
By Martin Lindegren (DTU) & Saskia Otto (UHAM)
In October 2022, MISSION ATLANTIC finalized a new report that summarizes efforts to assess the status, trends, and occurrence of abrupt transitions, as well as identify key drivers and potential cumulative impacts in Atlantic ecosystems. More specifically, the report showcases the results of a so-called “Integrated Trend Analysis” (ITA) carried out within each of the case study (CS) areas under Work Package 5 based on the best available data on indicator time series collected and compiled by project partners.
In terms of overall trends, we demonstrate a general increase in human activities, primarily in terms of gas extraction, aquaculture, fishing effort, and shipping. In addition to human sectors and pressures, changes in ocean climate and hydrography may also affect the status and trends of the biota in the CS areas. The general trend across CS areas is an increase in sea surface temperature (SST), which in some cases was accompanied by changes in sea surface height and water velocity, pointing towards changes also in circulation and hydrography alongside warming.
The potential responses of the biota to the sectors and pressures mentioned above may be reflected by changes in the various ecological components considered in each CS area (an example from the Norwegian Sea is shown below). However, to better highlight the key trends across all the ecological time series we used multivariate analysis to identify and visualize the main dimensions of variability in each CS area (i.e., principle components). Notably, the first dimension generally demonstrates a directional change (either positive or negative), while the second dimension is generally characterized by pronounced inter-annual, or decadal variability throughout the time period considered. This highlights that large-scale changes are indeed occurring in most of the Atlantic ecosystems; even if the directional changes are not necessarily affecting all components of the ecosystems.
Determining the key pressures that individually, or in combination may explain and regulate the observed changes in the biota is challenging (i.e., statistical correlations do not necessarily infer causation). Nevertheless, the CS partners used a range of methods to identify several state-pressure relationships. These point towards the effect of commercial fishing, climate/hydrography, or a combination of both that may, at least partially explain the observed changes. The identification of such multiple, interacting pressures will serve as an important source of knowledge and input to the downstream WPs, especially regarding semi-quantitative risk assessments.
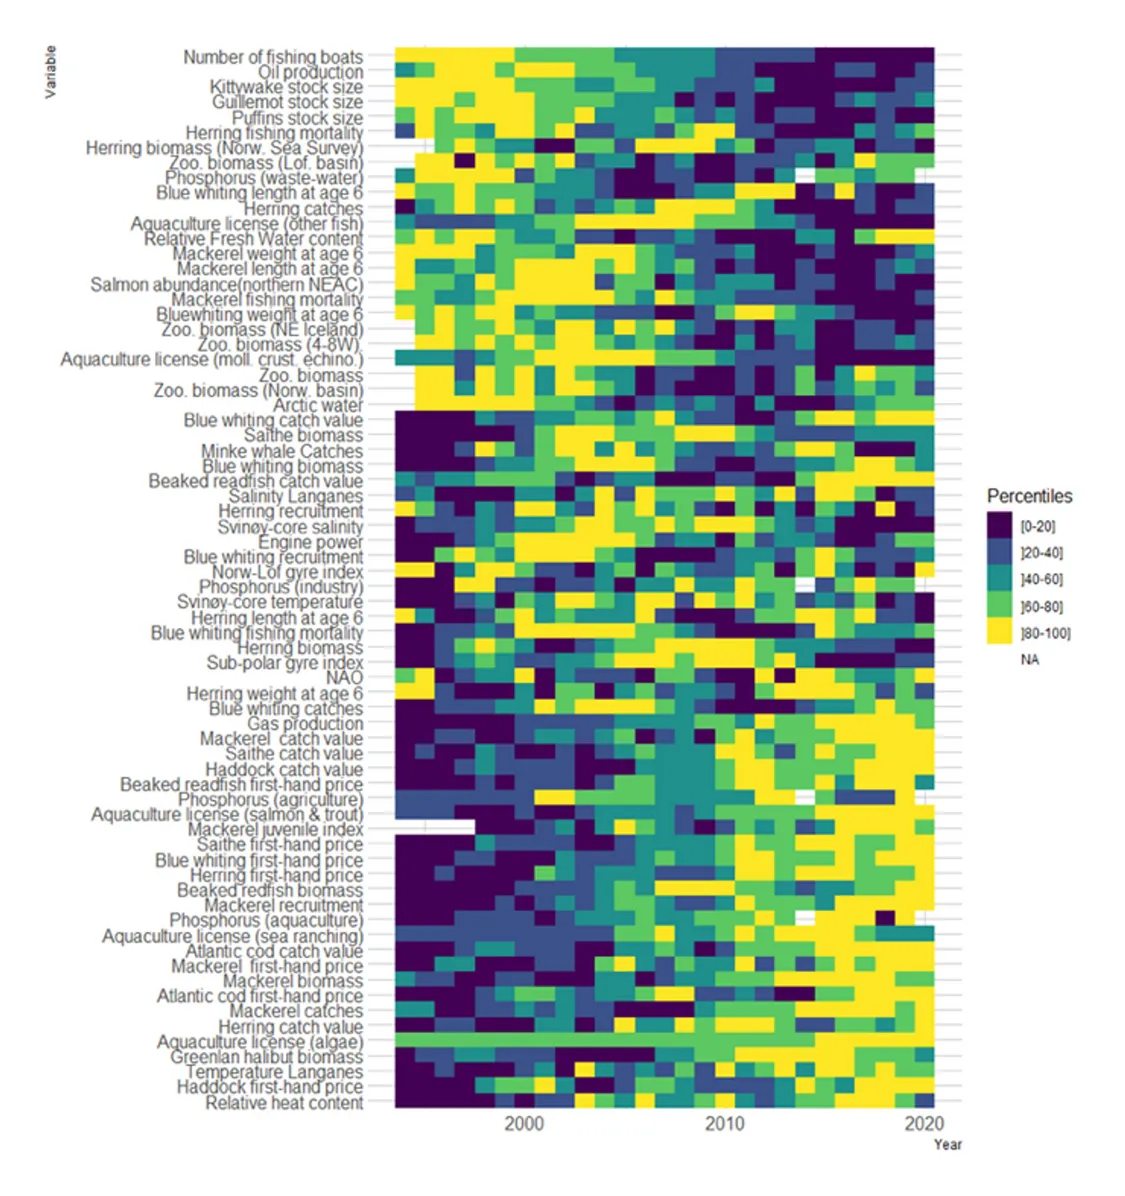
A traffic-light plot showing each of the individual indicator time series considered in the Norwegian Sea from 1994-2020. The indicators are colour coded according to the quintiles of their respective distribution, with years highlighted in dark blue and yellow indicating values in the lowest (0-20%) and highest (80-100%) percentile, respectively.
Read the full deliverable report 'D5.1 - States, drivers, cumulative impacts and tipping point indicators' here.