‘Information Fusion’ – Mapping Human Activities and Pressures
By Jose Antonio Fernandes
In July 2021, the first MISSION ATLANTIC workshop on ‘information fusion’ was held to map and better understand the impact of human activities and pressures on the whole Atlantic Ocean.
Information fusion collates, harmonizes, and integrates data and information from different sources and different granularities to provide continuous and complete data for analysis and modelling.
A typical ‘data fusion’ workflow includes collating and harmonizing the relevant data, running selected data fusion algorithms, viewing the resulting data sets and associated uncertainty estimates in geo-information systems, and then exporting the resulting new data for further analysis. The terms ‘information fusion’ and ‘data fusion’ are typically employed as synonyms (Castanedo, 2013); but usually the term ‘data fusion’ is used for raw data (obtained directly from the sensors) and the term ‘information fusion’ is employed to define already processed, ready-to-use data (higher semantic level), as planned in this project.
In MISSION ATLANTIC, ecosystem-based fisheries management (EBFM) data, from public sources, is being used. It will be complemented with data collected by traditional monitoring initiatives, modelling and satellite imagery to get a clearer understanding of all human impacts at the seven MISSION ATLANTIC case studies: Norwegian Sea, Celtic Sea, Canary Current, North Mid Atlantic Ridge, South Mid Atlantic Ridge, Benguela Current and South Brazilian Shelf.
However, to adopt ecosystem-based fisheries management (EBFM) requires consideration of all human impacts, not only the impacts of fishing. To do this, the ODEMM (Options for Delivering Ecosystem-based Marine Management) approach was employed to trace the sectors affecting the marine environment, the pressures they create, and the ecological characteristics affected (Pedreschi et al., 2019).
During this workshop, data sources were discussed for the following human activities and their pressures, which widely impact the Atlantic Ocean:
Shipping activities can be inferred from Automatic Identification System (AIS) data. Using a satellite system, AIS report a vessels’ position and are mandatory on all passenger ships irrespective of size, all vessels >300 MT (gross) transiting international routes, and any cargo ship > 500 MT (Eguíluz et al., 2016).
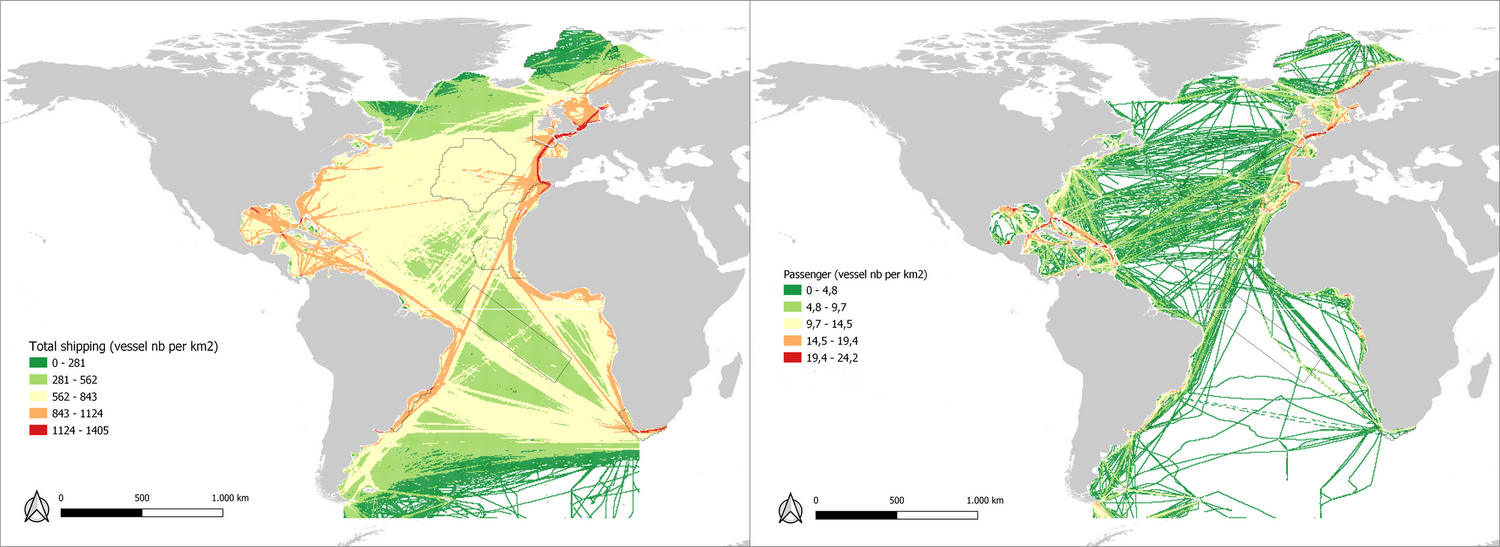
MISSION ATLANTIC has retrieved the 2014 AIS data (provided by Exactearth). The data is provided in five categories: cargo, tank, passenger, fishing, and other (Figure 1.a). The cargo, tank and other were aggregated representing shipping activities producing pressures in the pelagic environment. Passenger vessels are kept separate since they can be a proxy of the tourism sector (Figure 1b).
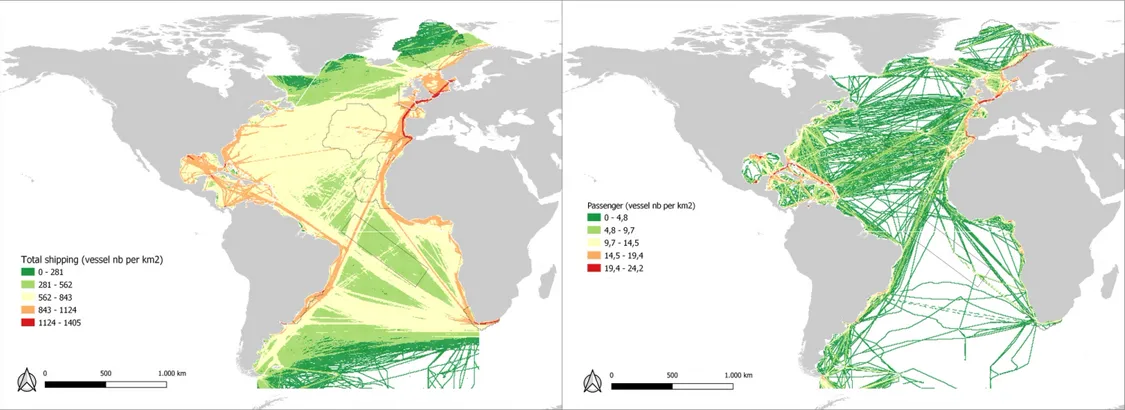
Figure 1. Density of vessels shipping in 2014. Density is calculated as the number of vessels per unit area (km2). The color scale is logarithmic. (a) Total density of vessels shipping and (b) density of passenger vessels shipping.
Fishing activities can be estimated by machine learning approaches (Kroodsma et al., 2018). This machine learning approach has been able to distinguish between fishing and routing activity of individual vessels, while differentiating up to seven main fishing gear types at the Atlantic Ocean scale (Taconet et al., 2019).
Aquaculture mapping is sparse (Fernandes-Salvador et al., 2021). However, the MISSION ATLANTIC team are developing algorithms to map open sea aquaculture based on satellite images. The same approach is likely to be useful for mapping of other activities such as non-renewables and sea minerals extraction.
Marine litter distribution in MISSION ATLANTIC will be based on the analysis of Continuous Plankton Recorder samples that has been an ongoing initiative for decades (Ostle et al., 2019).
River discharge and nutrient data, at global and large scale, are available in recent publications (e.g. (Virro et al., 2021). However, work on how to analyse and estimate discharges at sea is an ongoing activity in MISSION ATLANTIC.
Further reading:
- Castanedo, F. (2013). A review of data fusion techniques. The scientific world journal, 2013.
- Eguíluz, V. M., Fernández-Gracia, J., Irigoien, X., & Duarte, C. M. (2016). A quantitative assessment of Arctic shipping in 2010–2014. Scientific reports, 6(1), 1-6.
- Fernandes-Salvador, J. A., Davidson, K., Sourisseau, M., Revilla, M., Schmidt, W., Clarke, D., ... & Silke, J. (2021). Current Status of Forecasting Toxic Harmful Algae for the North-East Atlantic Shellfish Aquaculture Industry. Frontiers in Marine Science, 8, 656.
- Kroodsma, D. A., Mayorga, J., Hochberg, T., Miller, N. A., Boerder, K., Ferretti, F., ... & Worm, B. (2018). Tracking the global footprint of fisheries. Science, 359(6378), 904-908.
- Ostle, C., Thompson, R. C., Broughton, D., Gregory, L., Wootton, M., & Johns, D. G. (2019). The rise in ocean plastics evidenced from a 60-year time series. Nature communications, 10(1), 1-6.
- Pedreschi, D., Bouch, P., Moriarty, M., Nixon, E., Knights, A. M., & Reid, D. G. (2019). Integrated ecosystem analysis in Irish waters; providing the context for ecosystem-based fisheries management. Fisheries Research, 209, 218-229.
- Taconet, M., Kroodsma, D., & Fernandes, J. A. (2019). Global atlas of AIS-based fishing activity: Challenges and opportunities. Food and Agriculture Organization of the United Nations.
- Virro, H., Amatulli, G., Kmoch, A., Shen, L., and Uuemaa, E.: GRQA: Global River Water Quality Archive, Earth Syst. Sci. Data Discuss. [preprint], https://doi.org/10.5194/essd-2021-51, in review, 2021.