
By Clare Ostle (MBA)
A new report has been produced as part of MISSION ATLANTIC that details the datasets and ongoing surveys whos that are available for use within the project. Within this report, there are distribution maps for several ecosystem attributes, describing how these are changing over time.
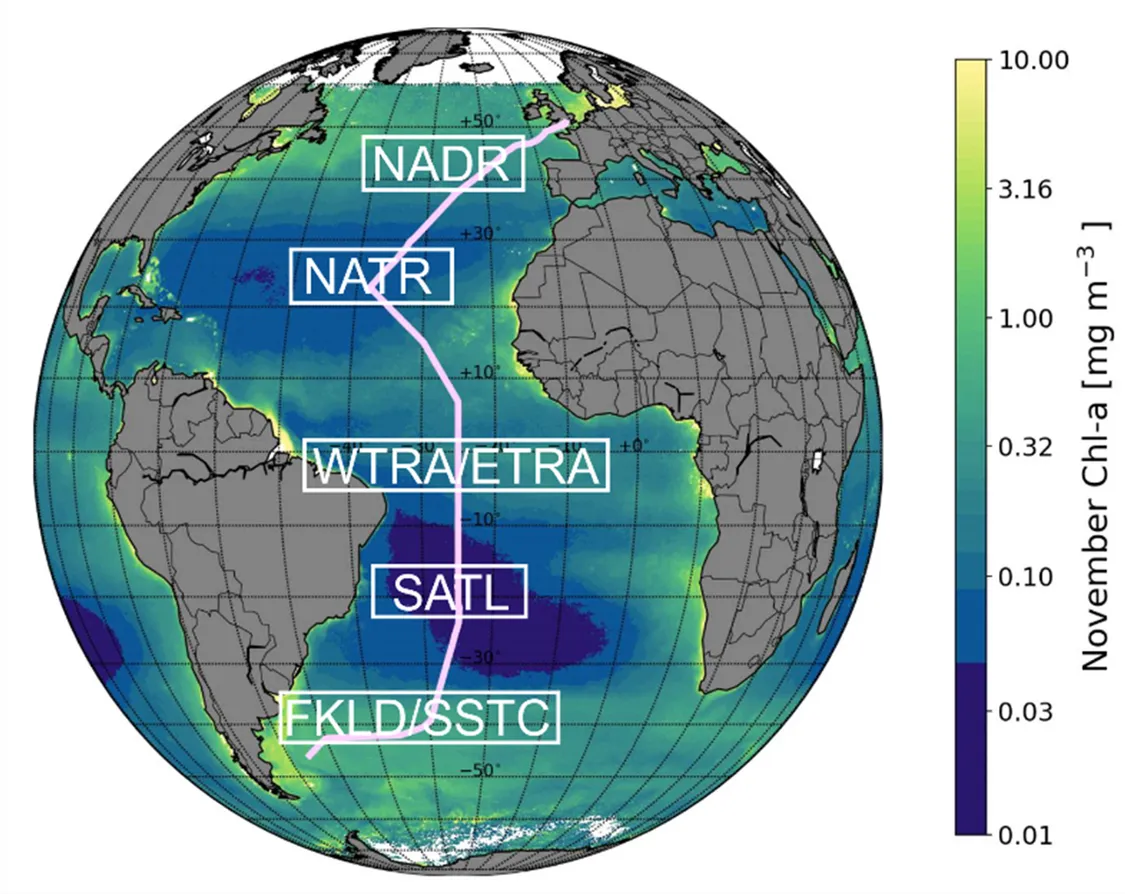
Proposed regions for analysis of zooplankton size spectrum over multiple decades. Figure adapted from the AMT29 (October 2019) cruise report (https://www.amt-uk.org/). Cruise track (pink line) and climatological chlorophyll concentration estimate by the OC-CCI product for November. Overlaid boxes are areas that have been selected for FlowCam Macro analysis of archived samples from archived AMT samples. FKLD/SSTC = Southwest Atlantic Shelves/South Subtropical Convergence region, SATL = South Atlantic Gyre, WTRA/ETRA = Western/Eastern Tropical Atlantic region, NATR = North Atlantic Tropical Gyre, NADR = North Atlantic Drift region.
The methods used to collect the data incorporate a range of historical techniques such as plankton tows as well as novel imaging techniques. Data are included from the Continuous Plankton Recorder (CPR), research cruises, fish tags, scientific echo sounding (active acoustics), satellite-derived products, and models.
Data presented cover the whole Atlantic Ocean, including a focus on the North Atlantic and the Cabo Frio Upwelling System in the South Atlantic. The results demonstrate that the Atlantic Ocean is highly variable and productive.
In the North Atlantic, a range contraction is shown over 60 years for copepod species associated with cold waters, linked to warming waters. Diel Vertical Migration (DVM) is also shown to be a prominent feature in North Atlantic zooplankton assemblages, with both Metridualucensand Pleuromamma spp. from the CPR survey presenting strong DVM patterns. Fish distribution and abundance have been mapped for several important species using echosounder data from the Atlantic Meridional Transect (AMT) and fish distributions have been modelled from public databases.
In the Cabo Frio Upwelling System in the South Atlantic, plankton distributions have been mapped demonstrating that the zooplankton in the area carry out DVM and apply grazing pressure on the phytoplankton. The vertical component of 2D Atlantic Ocean biogeographic maps produced was characterised using vertical distributions of fish extracted from echosounder data.
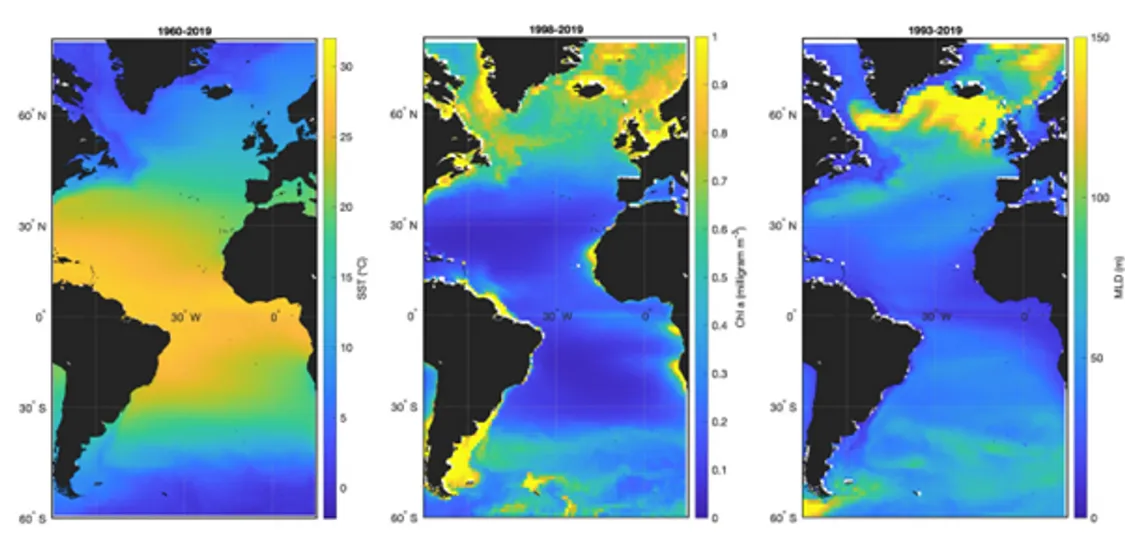
Maps of the Atlantic Ocean showing the mean a) Sea Surface Temperature (SST) from 1960-2019, b) Chlorophyll-a (Chl-a) from 1998-2019, and c) Mixed Layer Depth (MLD) from 1993-2019.
There are overlaps in species distributions with productive areas likely to be impacted by ocean warming, anthropogenic activities such as pollution, and de-oxygenation. The analyses presented in the report provide preliminary results for a range of ecosystem attributes that will be developed further throughout the duration of the MISSION ATLANTIC project.
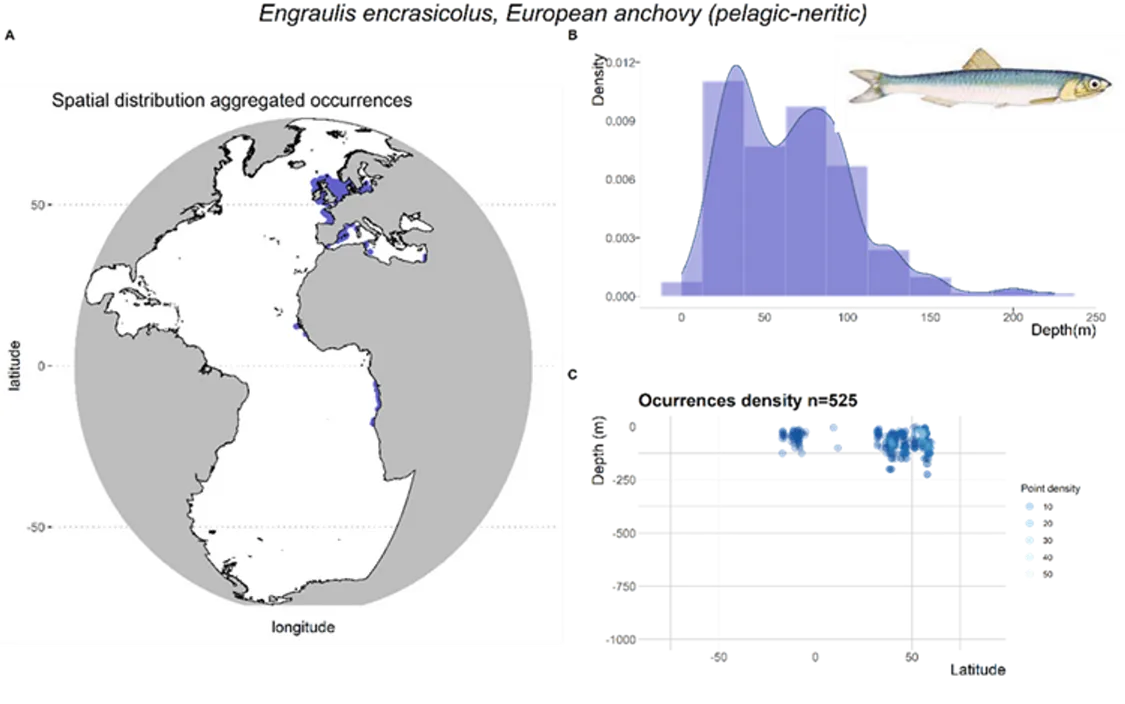
Spatial distribution of aggregated occurrence points retrieved occurrences from OBIS and GBIF for Engraulis encrasicolus, the European anchovy; B) Density plot of species occurrence along the depth gradient; C) Point density plot for occurrence data along latitude through the depth gradient.
Read the full deliverable report 'D3.1 - 3D maps of pelagic physical and chemical components and ecosystem attributes' here.